Analyzing pass sequences using clustering, LSTM and expected goals
See this GitHub repository for all code produced for this project.
Introduction
In my last post, I wrote about an expected goals (xG) model I created using Statsbomb’s public data. As a reminder, xG is a metric which measures the probability that a shot results in a goal. At the end of my last post, I mentioned that although these values are assigned to shots, expected goals can be used to analyze various other aspects of a soccer game as well. In this blog post, I’ll go through a pass sequence analysis I performed using the expected goals metric.
High level overview of the analysis
Before jumping into the analysis, let me frame the actual problem. As we know, the ultimate goal in soccer is to, well, score a goal. To accomplish this, teams attempt to progress the ball into their opponent’s end in order to take a shot. It sounds simple enough, but there are practically an infinite number of pass sequences which could yield a shot. So what makes one pass sequence better than another? The basic idea behind this analysis is that pass sequences that lead to shots which have a high probability of resulting in a goal are better than those which either don’t tend to yield shots, or those which yield poor quality shots. In other words, pass sequences which produce shots with high xG values are better than sequences which produce low xG valued shots.
Extracting the pass sequences
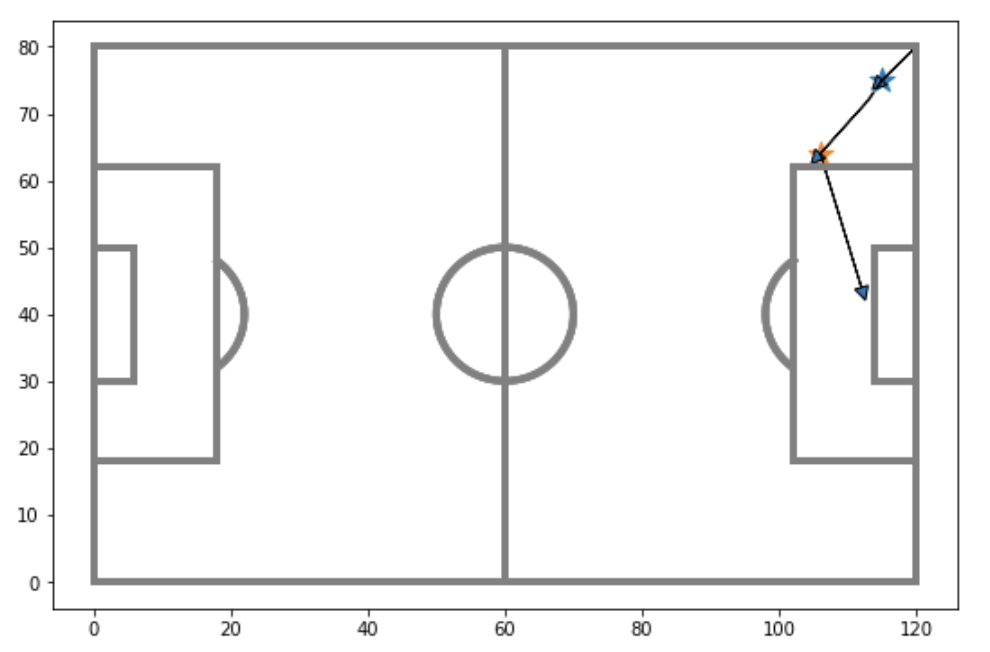
The first step in the analysis was to extract the pass sequences from Statsbomb’s event data. Each game in this repository has its own JSON file, where the events which occured in the game are listed sequentially, with associated event IDs. These events include passes, ball carries, shots, etc, and each one comes with some information, such as the location and time at which it occured. Conveniently, each event also has a field called “related events”, which lists other events that occured as a direct result. For example, if pass A led directly to pass B, then pass B would be considered ‘related’ to pass A in the data file. I used this information to determine which passes made up a specific sequence, and whether or not each sequence led to a shot. This allowed me to extract pass sequences such as the one shown below. This specific sequence did not lead to a shot.
In all, I extracted over 150 000 such sequences from Barcelona matches between the 2004/05 and 2018/19 seasons. I then assigned an xG value to each sequence, based on the xG value of the shot it produced. Of course, many (in fact most) sequences did not lead to shots, and so these sequences were simply given an xG value of 0.
Pass clustering
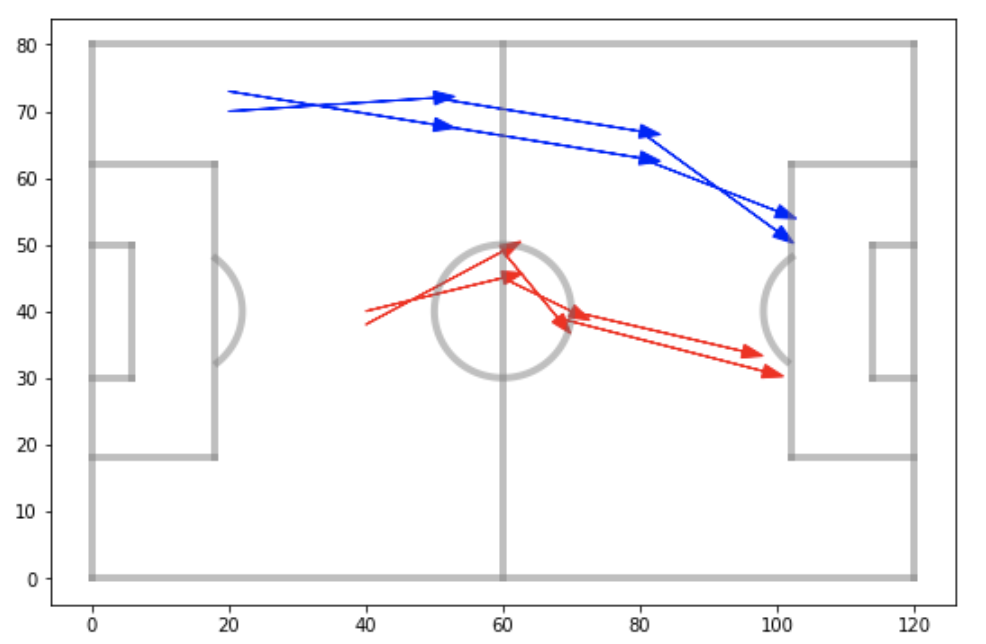
So I had pass sequences with associated xG values. Each sequence was unique in the specific start and end locations of its passes. However, the goal of this analysis was to determine which sequences, in general, lead to high quality chances, not to quantify the quality of each specific pass combination. This distinction is best understood with an example. Consider the four pass groups shown below. Each pass sequence would have its own xG value. However, the goal was not to determine which of the two blue pass sequences is the best, but rather, if pass sequences similar to those in blue tend to produce better chances than those in red.
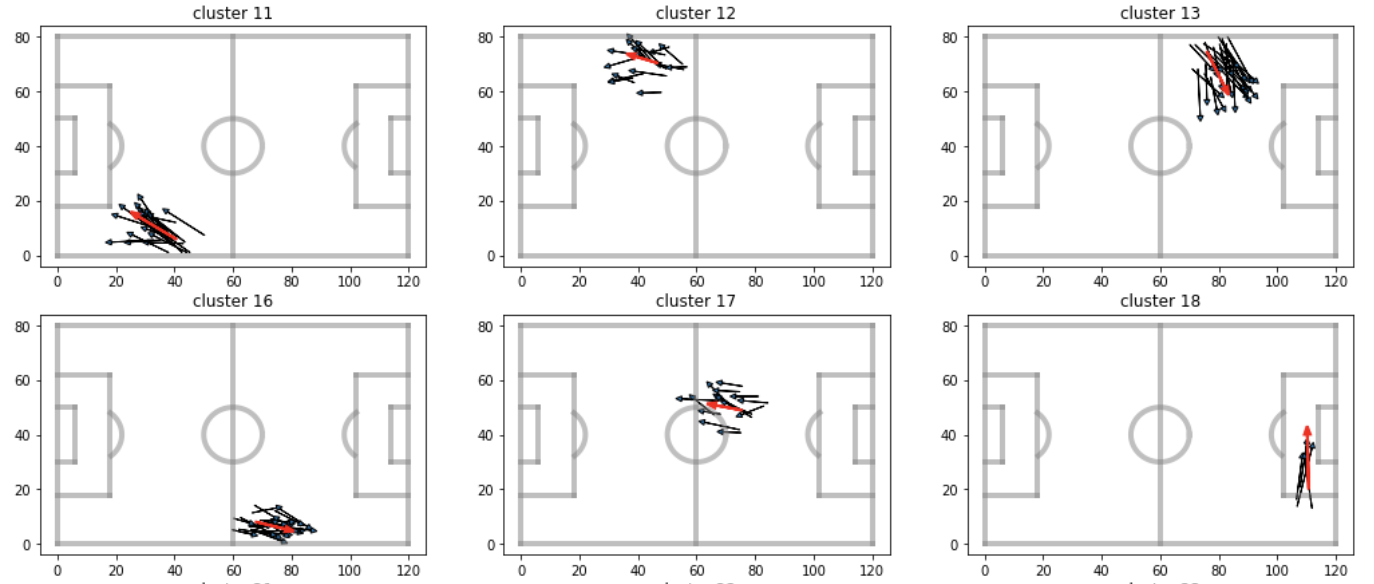
In order to do this, I grouped passes together based on their similarity using the k-means clustering algorithm, which I wrote about in an earlier blog post. Without going into the technical details, this method partitions numerical data points, such as passes, into k-distinct groups (clusters), and each group is defined by an average point. When applied to passes, we get groups which look like those shown below. In this figure, the black arrows are the raw passes, and the red arrows are the group-defining average passes. Only 4 groups are shown below, but in all, I ended up with 400 different pass clusters.
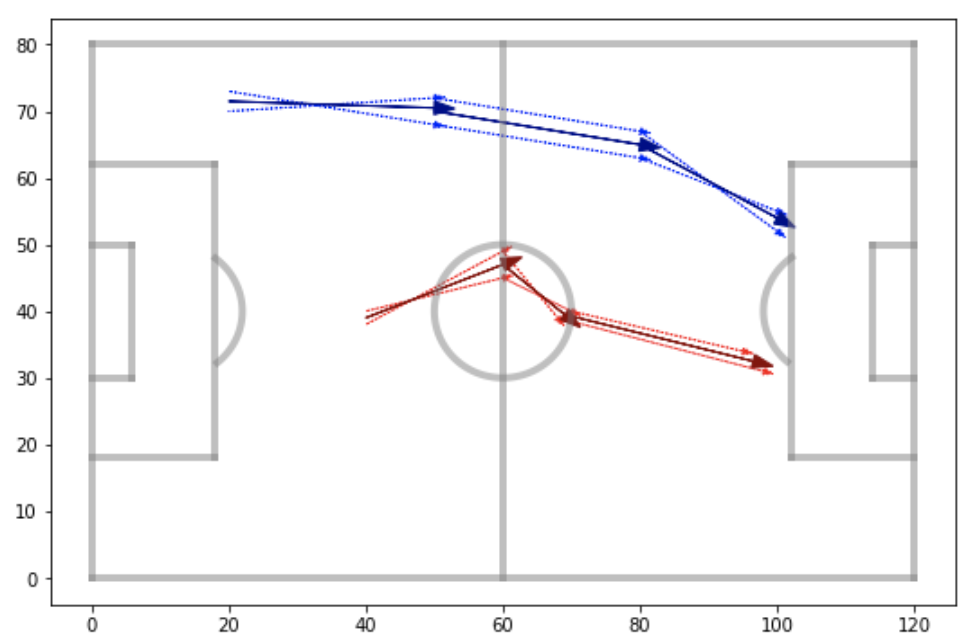
What the groups above allowed me to do is replace each pass by the average pass of its group. Thus, instead of having unique sequences, all with slightly different passes, each sequence could now be represented as a sequence of ‘pass groups’. Going back to the example shown earlier, the sequences in blue would be replaced by the thick blue sequence below, and similar for the red passes. The sequence data would end up consisting of two examples of the thick blue sequence, with xG values given by the original sequences, and two examples of the red, again with xG values given by the original sequences.
Sequence evaluation using LSTM
A common and powerful method for sequence analysis is the use of a recurrent neural network (RNN). These models are capable of finding complex relationships between input sequences (in this case, the pass group sequences) and their associated outputs (in this case, the associated xG). They achieve this through a built-in mechanism whereby they can process elements of a sequence one at a time, while remembering what has come previously. An LSTM model is a specific type of RNN, which, without going into the details, solves certain issues that arise with classic RNNs. To analyze the pass sequences, I built an LSTM model using the Keras library in python. Essentially, by feeding in the sequences and their associated xG values, the model was able to learn what combinations of pass groups tend to lead to high quality chances, and which ones lead to low quality chances. Importantly, I pre-processed the data so that the model only considers the 3 final pass groups in each sequence. Note that as per the usual machine learning pipeline, I only showed my model a fraction of all the sequences, reserving some of the data for model evaluation.
Results
With the LSTM trained, I fed the model with the portion of the data it hadn’t seen. Each unseen sequence was given a predicted xG value by the model. Below are the pass group sequences with the highest predicted xG scores. The numbers attached to each arrow represent the order of the pass groups in each sequence.
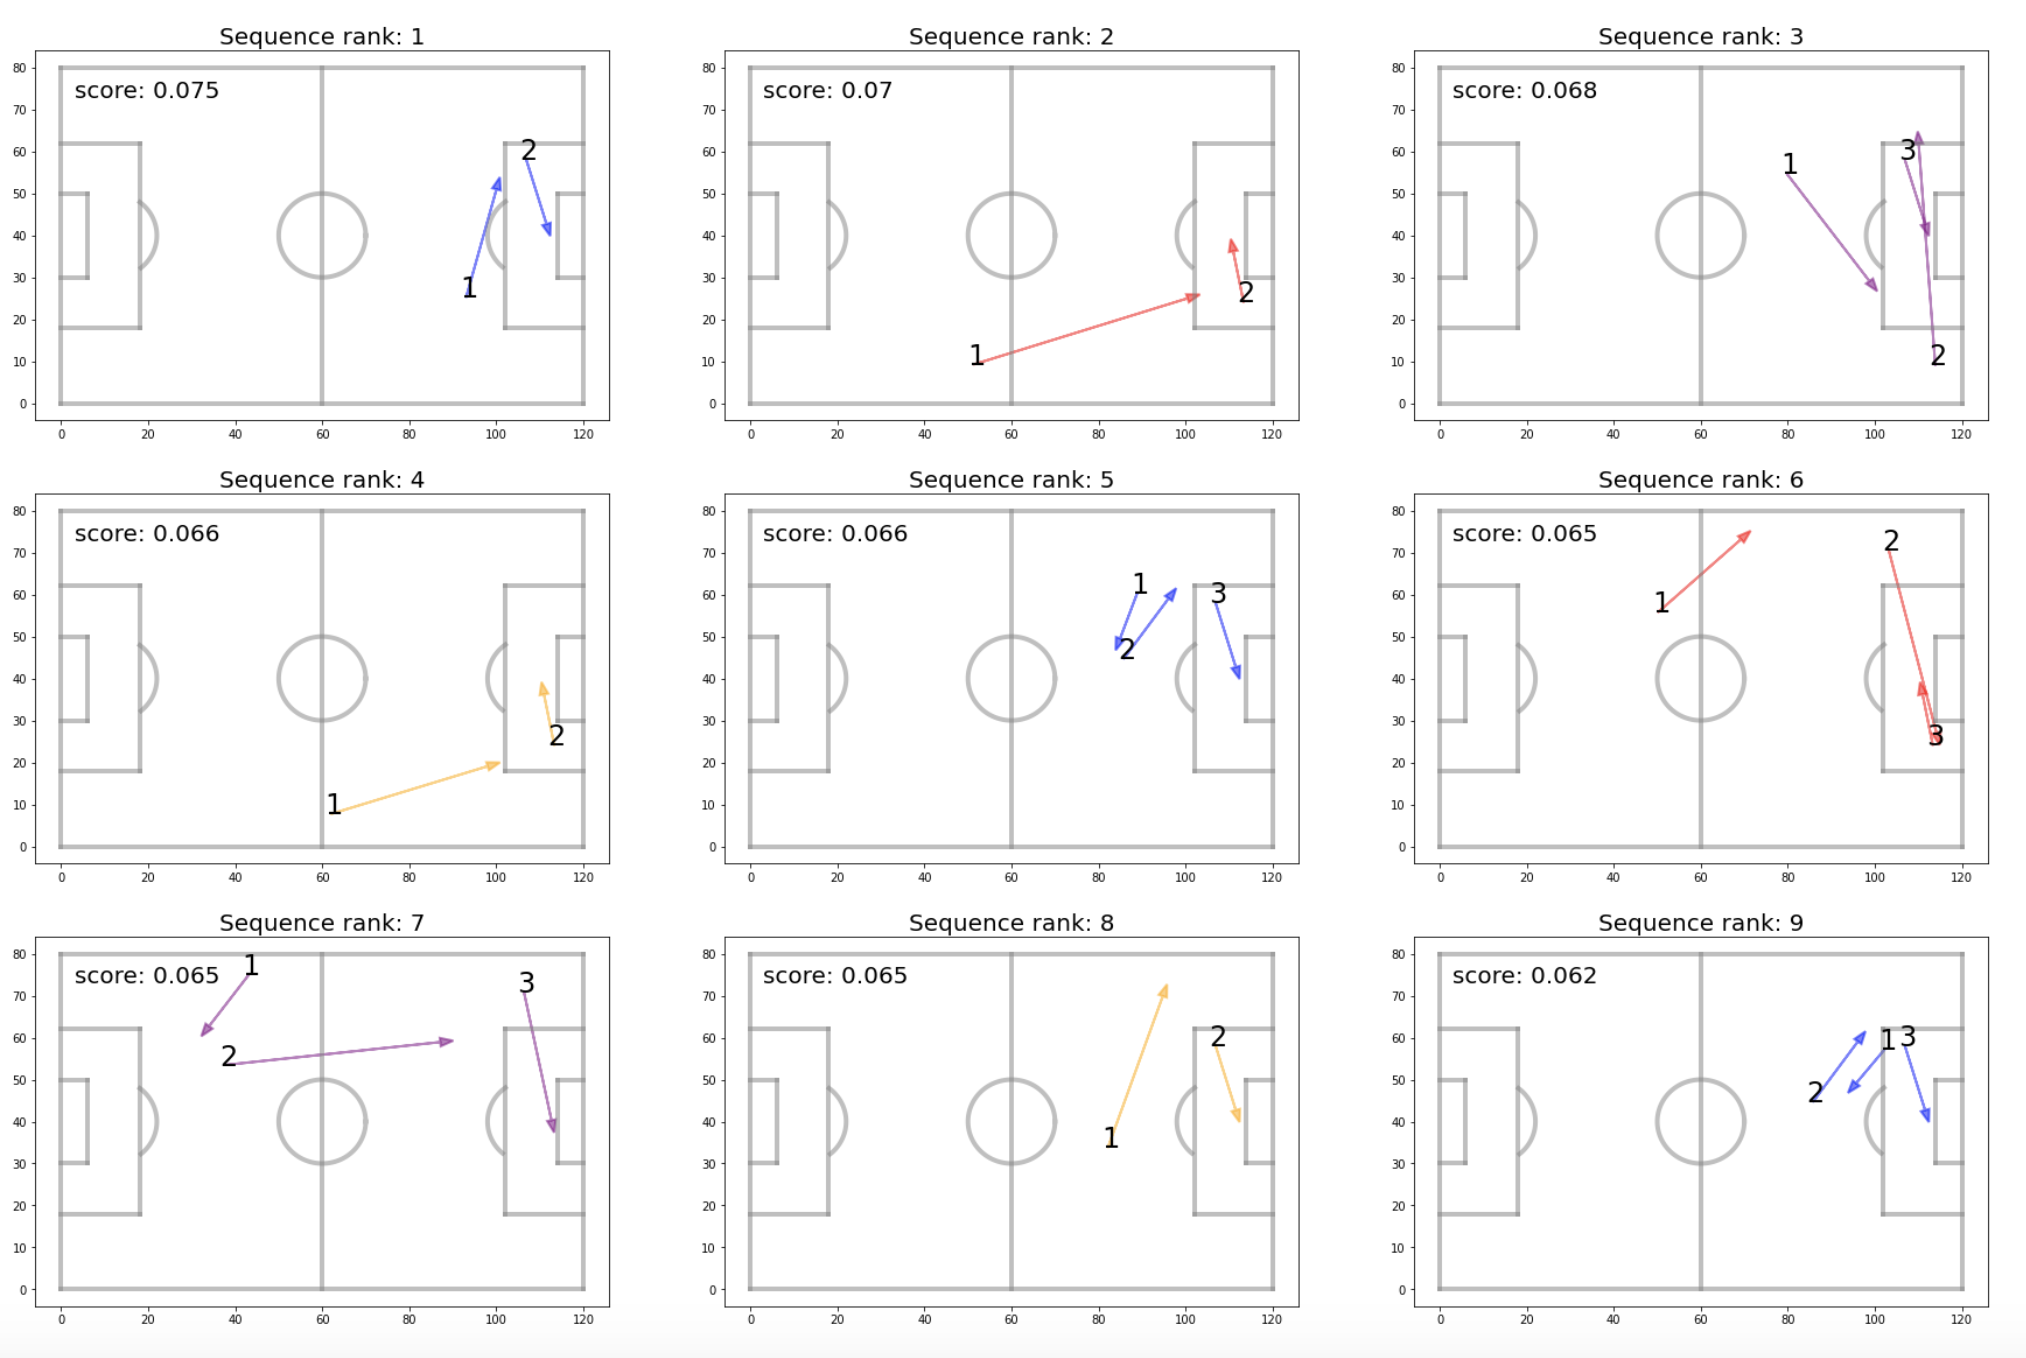
An interesting insight arises when we look at the 9 highest valued pass group sequences: they all end with short passes across the box. Based on these results, it appears that trying to engineer a shot by playing the ball down the sides for a short pass across the net is better than playing through the middle. However, it is important to keep in mind that the model was trained using many sequences which did not lead to shots and which were given an xG value of 0. Therefore, it is possible that pass sequences down the middle were given lower predicted xG, not because the shots they lead to are poor, but because they tend not to lead to as many shots. Thus, the model isn’t saying that players should never make passes down the middle and always try to go down the sides. Rather, it is saying that in the long run, taking into account how likely a sequence is to lead to a shot as well as how likely that shot is to go in, passing sequences down the sides will lead to more goals.
Applications of this pass sequence analysis
This pass sequence analysis can be used by coaches to evaluate their own team’s attacking play, as well as opposition teams. For example, this analysis could be applied separately to each team in a given league. Because teams vary in style and in their players’ qualities, pass sequence scores may vary from team to team. Thus, depending on the opposition they will face, a coach may want to place extra emphasis on shutting down particular passing avenues. On the other hand, a team may be going through a dry run where they are stuggling to score goals. By looking at the passing sequences they play most often, they may find that they are using combinations which result in low quality chances. In such situations, coaches may want to instruct their players to use different patterns of play.
Conclusion
Progressing the ball through pass sequences is how soccer teams attempt to create goal scoring opportunities. Therefore, if a team wants to score a lot of goals, it is crucial that it finds efficient pass sequences that will lead to high quality chances. Similarly, if a team wants to avoid conceding goals, it is crucial that it stops the opposition from exploiting high quality sequences. While a team shouldn’t blindly follow all of a model’s insights, this blog post serves as an example of how pass sequence analyses can be useful to help inform tactics.