Clustering Barcelona's passes using k-means
See this GitHub repository for all code produced for this project.
The k-means clustering algorithm is one of the most frequently used machine learning algorithms. Its purpose is to partition a set of unlabelled data points, which possess quantitative features, into k distinct groups. The algorithm achieves these groupings through an iterative process where k ‘centroids’ are calculated based on the data at hand. The k centroids define the k groups, and each data point is assigned to the group with the centroid it is most similar to.
Among the many applications of this clustering algorithm, k-means can be used to cluster a soccer team’s passes. In fact, using k-means, passes can be separated into groups based on their starting location, length and direction. This technique has been done many times in the past, but here, I apply it to Barcelona’s passing data, provided by Statsbomb.
Passing analysis with k-means: methodology
The ultimate goal of this exercise is to determine what kind of passes Barcelona play more often (and less often) than their opponents. We can all agree that the peak of Barcelona’s passing dominance came during the Pep-era, and so in this analysis, I’ll use data from the 2009/10 season.
The first step in achieving the passing clusters is to calculate the actual centroids themselves. The centroids are calculated by feeding through all of Barcelona’s passes, as well as their opponents’ passes, into the k-means algorithm.
Important note: Statsbomb only released La Liga data for matches in which Barcelona participated. As a result, this will mean that Barcelona’s passes will weigh much more heavily than those of their opponents in the calculation of the centroids. This, of course, is not ideal, but the methodology used here is still valid, and applying it to all the data would yield better results.
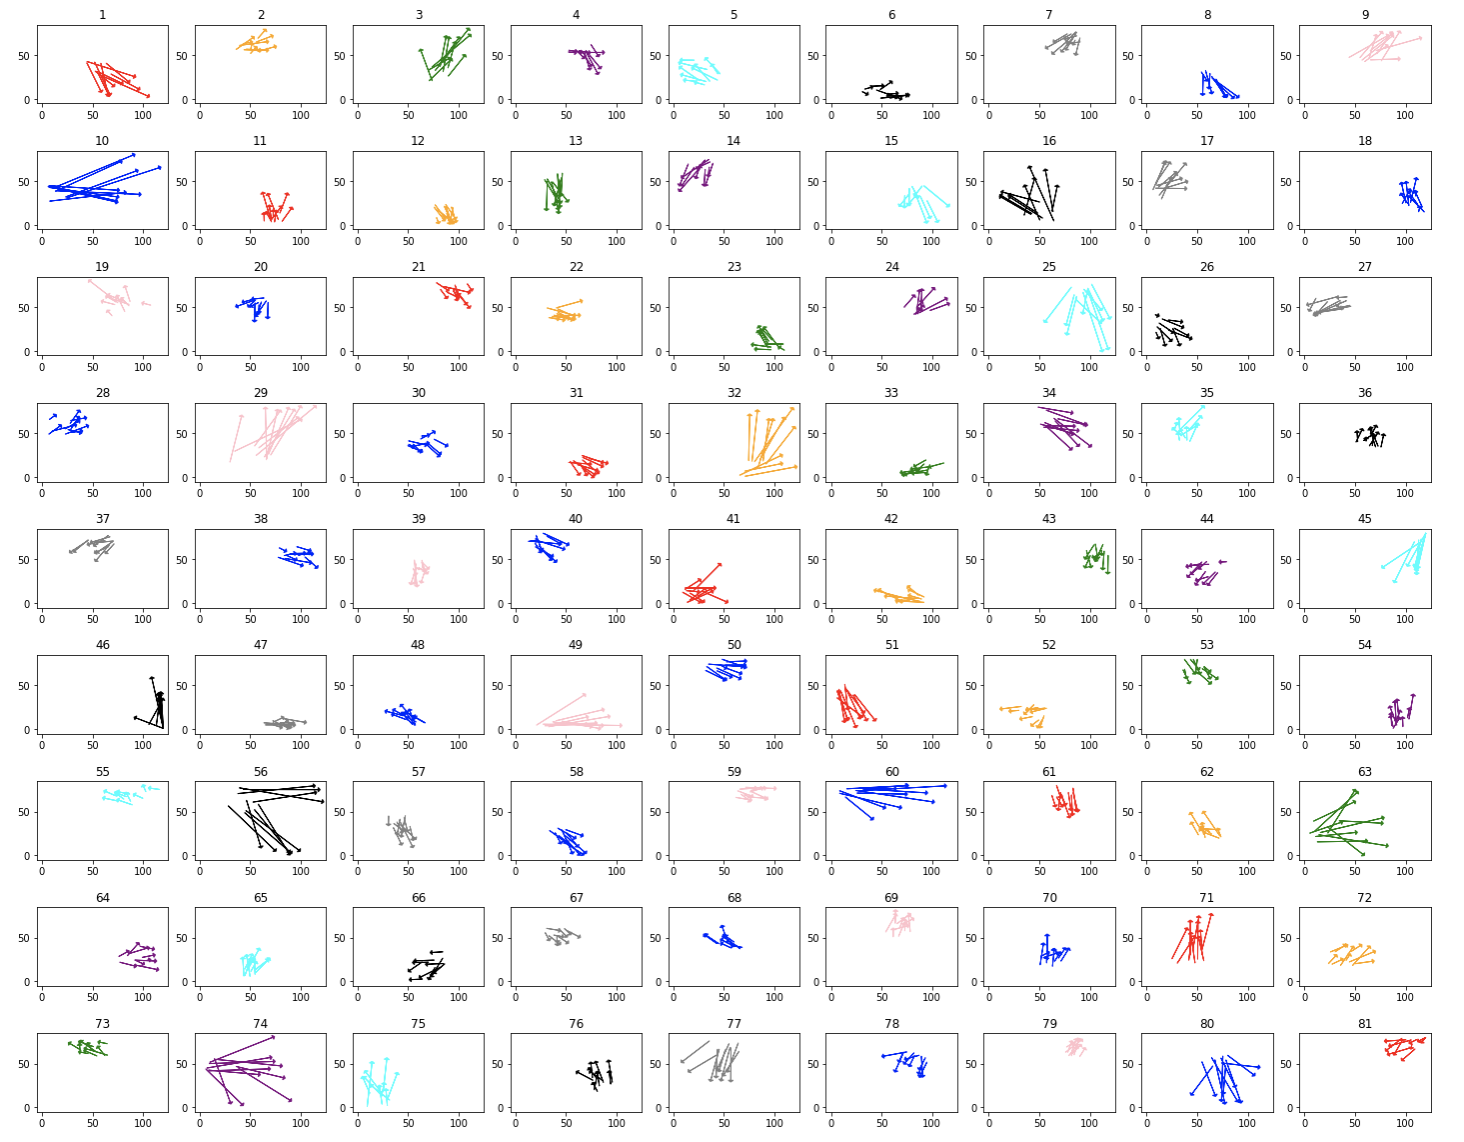
Luckily, python’s sci-kit learn library has a great k-means clustering class. First though, it is neccesary to apply a standard scaler to the 4 passing features (x-starting position, y-starting position, length, direction) so that they all weigh equally when clustering. The next step is choosing the number of clusters and feed the data into the algorithm. In the end, through mostly visual inspection (the commonly used elbow-method did not prove to be very useful), I landed on 81 clusters. You can see the 81 different clusters below:

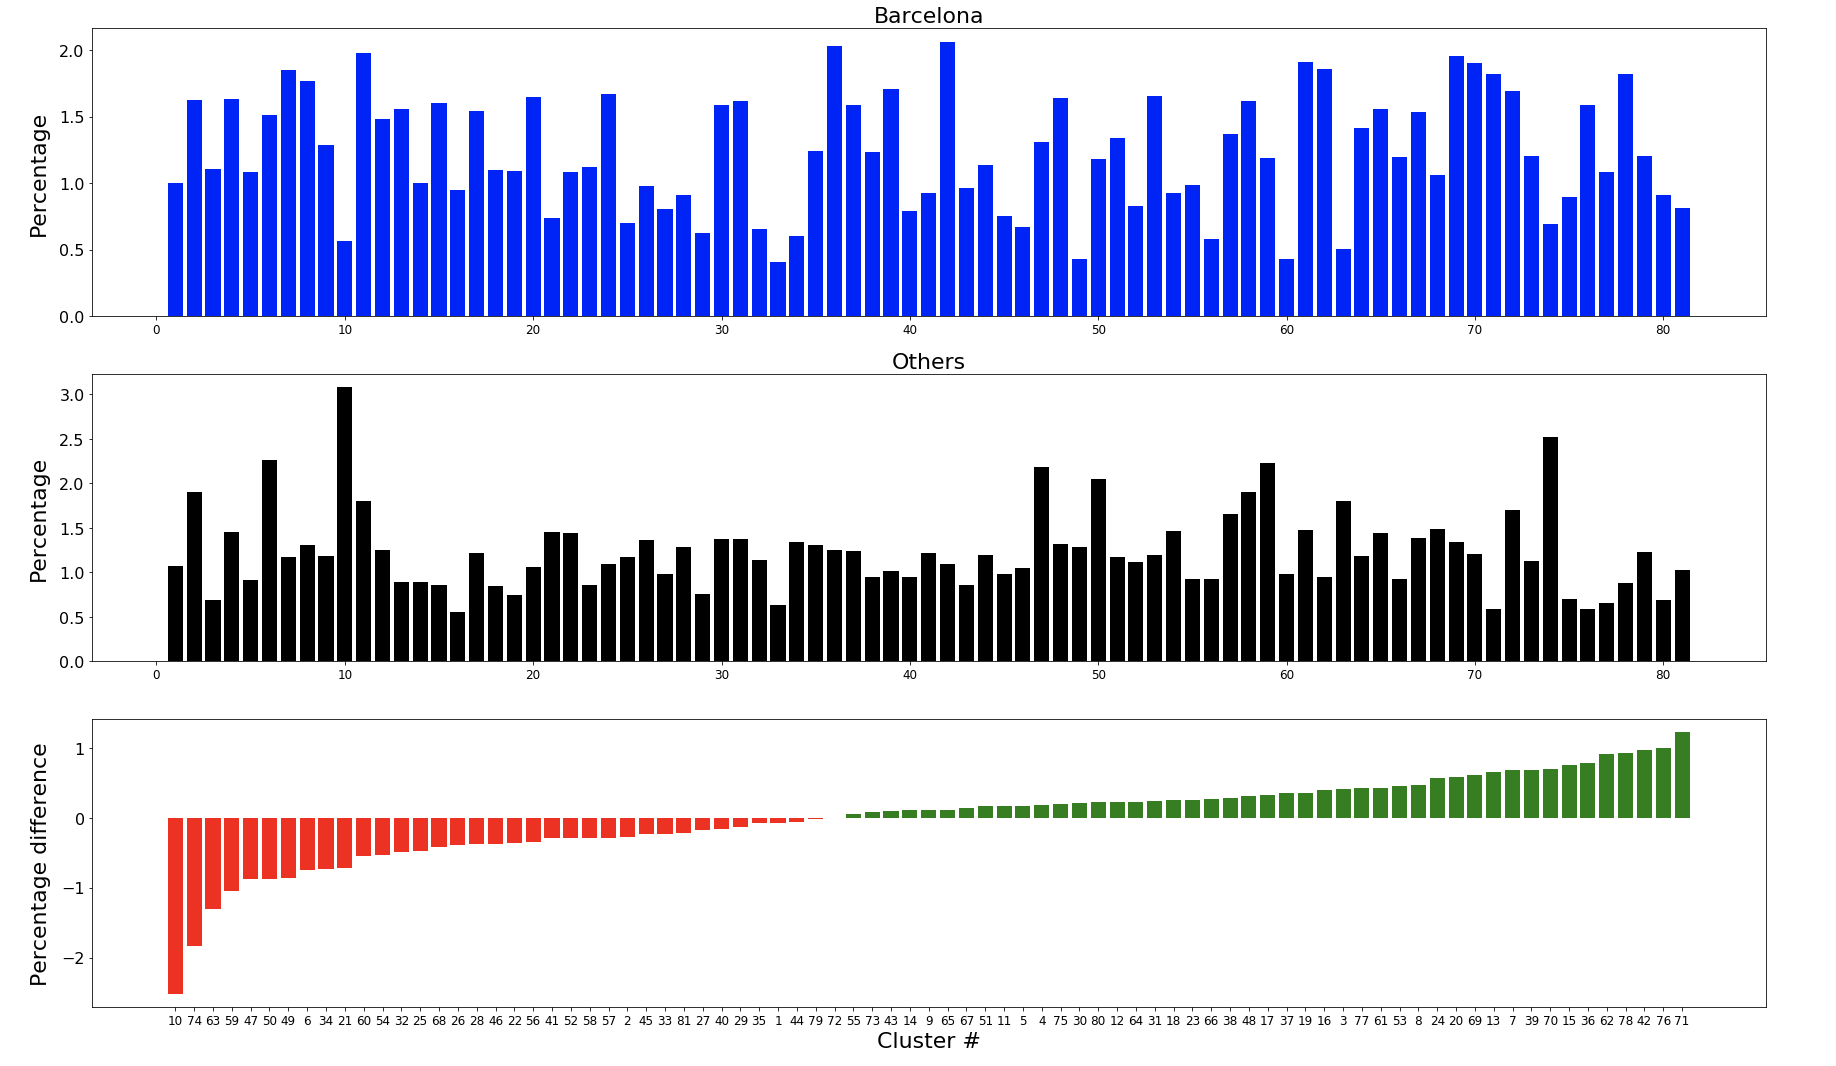
Having now defined our clusters, the next step is to determine the percentage of Barcelona’s passes which were assigned to each cluster, as well as their opponents’ percentages. These two sets can then be compared, and their differences would reveal which pass clusters Barcelona play more often than their opponents, and vice-versa. The results are shown in the plots below:

Barcelona’s top and bottom pass clusters
We can see, above, that the pass clusters that Barca used most often compared to their opponents are numbers 71, 76, 42, 78 and 62:

On the other hand, the pass clusters that Barca used least often compared to their opponents are numbers 10, 74, 63 and 59:

So we’ve now determined which pass clusters Barca used most often, and least often, compared to their opponents during the 2009/10 La Liga Season. In particular, the least-used pass clusters tell us something that we already know: Barca play far less long balls than their opponents.
Extending this analysis
The real interesting insights come when we extend this clustering analysis. We could, for instance, look at the chains of pass clusters that Barca use most often, or even better, we could look at the chains of pass clusters that lead to the best chances for Barca (measured by the expected goal values of the shots that result from these chains - this may come in a future blog post). This knowledge would be especially useful for teams which may need to play against Barcelona, as they could focus on shutting down dangerous attacking avenues. Barcelona themselves could also benefit from such an analysis, as they could evaluate which passing sequences work best for them, and perhaps favour these over sequences that lead to low quality chances.
Conclusion
We saw in this post how to cluster a soccer team’s passes using the k-means algorithm, and that this can tell us useful information about how Barcelona play. We also saw how this analysis could be extended to yield more interesting insights. Ideally, it would have been nice to have data for all La Liga games so that the clusters could be calculated by equally weighing all teams’ passes. Additionally, this would allow us to compare Barca’s pass cluster percentages against a distribution of all teams, rather than against all of their opponents lumped together. Nevertheless, this exercise has certainly shown how powerful this method can be in quantifying a team’s playing style.